
A entity relationship model (E-R model) is the design of the logical structure of a database, which can then be implemented as a real database. The main components of the E-R model are a set of entities and relationships.
An entity-relationship model describes interrelated things of interest in a specific domain of knowledge. In software engineering, the E-R model is generally used to incorporate things that a company needs to remember to carry out business processes..
It is usually the derivation of a systematic analysis to specify and represent what is significant for the processes in some business area. It only graphically presents a business data design, without defining the processes.
Therefore, it is an easy-to-use graphical tool for modeling data, widely used in database design, which helps to identify the entities that exist in a system and the relationships between those entities..
Generally, it is drawn with boxes (entities), which are connected by lines (relationships), expressing the dependencies and associations between those entities.
Article index
A relationship entity model is generally implemented as a database. In a simple relational database implementation, each row in a table constitutes an instance of an entity, and each column constitutes an attribute.
Entities are characterized not only by relationships, but also by additional properties called attributes, which contain identifiers called "primary keys.".
Diagrams introduced to represent entities and relationships, as well as attributes, can be called entity-relationship diagrams (E-R diagrams), rather than entity-relationship models.
Therefore, the structure of a database is described with the help of the entity relationship diagram.
Consequently, the E-R model becomes an abstract data model, which defines an information structure that can be implemented in a database, commonly relational.
Data modeling came into vogue in the 1970s driven by the need to properly model databases or even real-world business processes.
Peter Chen popularized the entity-relationship model in his famous 1976 article "The entity-relationship model - towards a unified view of data".
It was proposed to create a standard convention that could be used for relational databases. His goal was to use the E-R model as a conceptual approach to modeling..
Peter Chen stated in his article: “The entity-relationship model takes a more natural view of the real world, consisting of entities and relationships. It incorporates part of the important semantic information about the real world ".
In addition to database design, Chen's E-R model also serves well in information modeling systems and applications. The Unified Modeling Language (UML) is derived in many ways from the entity-relationship model.
The previous year, A. P. Brown had published an article called "Modeling a Real World System and Designing a Schematic to Represent It" in a publication of the International Federation for Information Processing..
While Brown's article was relevant, Chen's article was even more relevant, especially as it focused on the terms "entity" and "relationship." This is generally considered the beginning of the data modeling practice as it is currently known..
Bachman diagrams, a form of data modeling, also deserve mention.
Charles Bachman's 1969 article for the Data Base publication introduced the concept of database "entities" and was one of the first data structure diagrams, later to be known as the Bachman diagram. This was very influential on Peter Chen.
Chen was in accordance with the philosophical and theoretical traditions from the time of the ancient Greek philosophers Socrates, Plato and Aristotle (428 BC) to the modern epistemology, semiotics and logic of Peirce, Frege and Russell.
Plato himself associates knowledge with the apprehension of immutable forms. According to Socrates, forms are archetypes or abstract representations of the many types of things and properties, and of their relationships to each other..
The entity relationship diagram shows the relationships of the set of entities stored in a database. That is, E-R diagrams help explain the logical structure of databases.
Example: a particular song is an entity, while the collection of all songs in a database is a set of entities.
At first glance, an E-R diagram looks very similar to a flow chart. However, the E-R diagram includes many specialized symbols, and their meanings make this model unique..
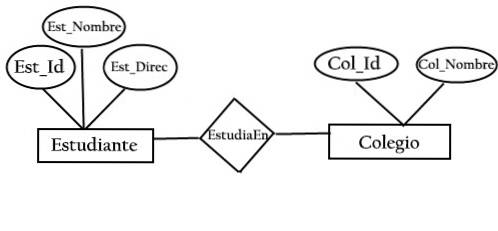
In the following diagram there are two entities, Student and School, and their relationship. The relationship between Student and School is many to one, since a school can have many students, but a student cannot study in several schools at the same time.
The Student entity has attributes such as its identification (Est_Id), name (Est_Nombre) and address (Est_Address). The College entity has attributes such as its identification (Col_Id) and name (Col_Nombre).
- Rectangle: represents the set of entities.
- Ellipse: represents the attributes.
- Diamond: represents the set of relationships.
- Lines: bind attributes to entity sets, and entity sets to relationship sets.
- Double ellipse: multivalued attributes.
- Dashed Ellipse: Derived Attributes.
- Double Rectangle - Weak Entity Sets.
An entity is something in the real world, which is easily recognizable. It is anything in the company that will be represented in the database. It can be something physical or just a fact or event that occurs in the real world.
It can be a place, person, object, event or concept, which stores data in the database. The characteristic of entities is that they must have an attribute as a unique key. Each entity is composed of some attributes that represent that entity.
Entities can be thought of as nouns. Examples: a computer, an employee, a song, a mathematical theorem, etc..
A weak entity is an entity that cannot be uniquely identified by its own attributes and is based on a relationship with another entity.
For example, a bank account cannot be uniquely identified if the bank to which it belongs is not known. Therefore, the bank account is a weak entity.
An attribute describes the property of an entity. It is represented by an oval shape on an E-R diagram. There are four types of attributes:
It is the attribute that can uniquely identify an entity from a set of entities. For example, the student ID number can uniquely identify a student from a pool of students.
The key attribute is represented by an ellipse just like the other attributes. However, the key attribute text is underlined.
It is an attribute that can contain multiple values. Represented by double ellipses in an E-R diagram.
For example, a person can have more than one phone number, so the phone number attribute has multiple values.
It is one whose value is dynamic and is derived from another attribute. It is represented by a discontinuous ellipse in an E-R diagram.
For example, a person's age is a derived attribute, as it changes over time and can be derived from another attribute: date of birth.
A relationship shows how entities are related to each other. They can be considered as the verbs that join two or more nouns. It is represented by the diamond shape in the E-R diagram..
Examples: the relationship between a department and an employee, between a computer and a company, the relationship between a theorem and a mathematician, between an artist and a song, etc..
Cardinality specifies how many instances of one entity are related to one instance of another entity. Ordinality is also closely linked to cardinality.
While cardinality specifies the occurrences of a relationship, ordinality describes the relationship as required or optional. The symbology used for this is the following:
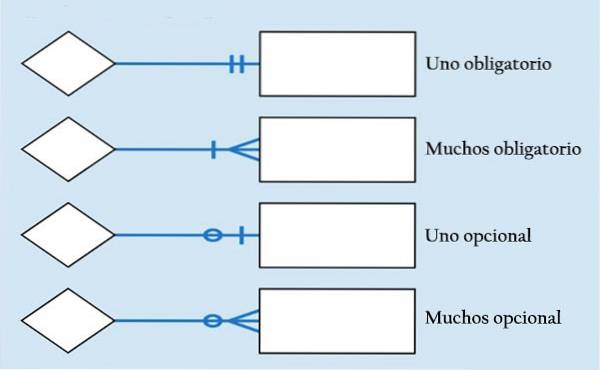
In other words, cardinality specifies the maximum number of relationships and ordinality specifies the absolute minimum number of relationships. In this sense, there are four types of relationship:
It is when a single instance of an entity is associated with a single instance of another entity.
For example, a person only has one passport and only one passport is given to one person.
It is when an instance of an entity is associated with more than one instance of another entity.
For example, one customer can place many orders, but many customers cannot place an order..
It is when more than one instance of an entity is associated with a single instance of another entity.
For example, many students can study at only one university, but one student cannot study at many universities at the same time..
It is when more than one instance of an entity is associated with more than one instance of another entity.
For example, one student can be assigned to many projects and one project can be assigned to many students.
When documenting a system or process, observing the system in multiple ways increases understanding of that system.
Entity-relationship diagrams are commonly used to display the contents of a database. They help to visualize how data is connected in a general way, and are particularly useful for building a relational database.
Here are the steps required to build a relationship entity model:
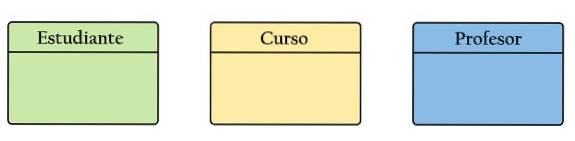
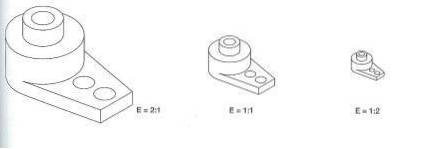
The first step in making an entity relationship diagram is to identify all the entities that will be used. An entity is nothing more than a rectangle with a description of something about which the system stores information.
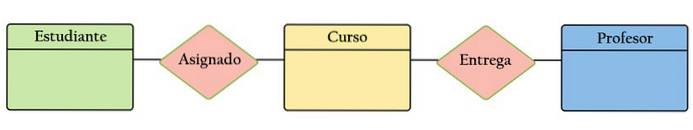
A rectangle should be drawn for each entity that you can think of. As an example there are the following three entities:
Two entities are looked at, if they are related to each other, a continuous line is drawn that connects the two entities.
To describe the relationship of the entities, a diamond is drawn between the two entities, on the line just added.
A brief description of how they are related should be written on the diamond. Following the example, we have the following:
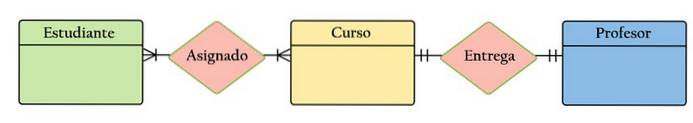
For the purposes of the example in question, it is known that a student can be assigned in multiple courses and a teacher can only teach one course. Therefore, the diagram looks like:
The files, forms, reports and data that the organization currently maintains should be studied to identify the attributes. Interviews with multiple stakeholders can also be conducted to identify entities. Initially, it is important to identify the attributes without assigning them to a particular entity.
Once you have a list of attributes, they must be assigned to the identified entities. Make sure that an attribute matches exactly one entity. If an attribute is believed to belong to more than one entity, a modifier must be used to make it unique.
After the mapping is done, the primary keys are identified. If a unique key is not available, one must be created.
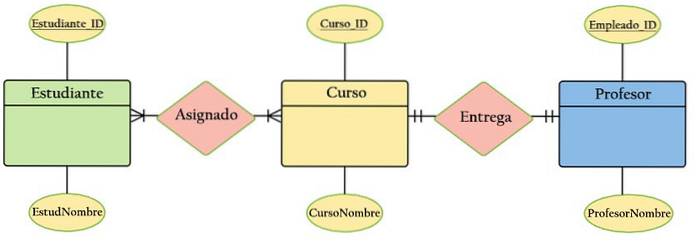
For the purposes of facilitating the example, only one attribute is shown for each entity, in addition to the key. However, more attributes could be identified. Primary keys can be distinguished from other attributes because they are underlined.
Continue connecting the entities with lines and adding the diamonds to describe each relationship, until all relationships have been described..
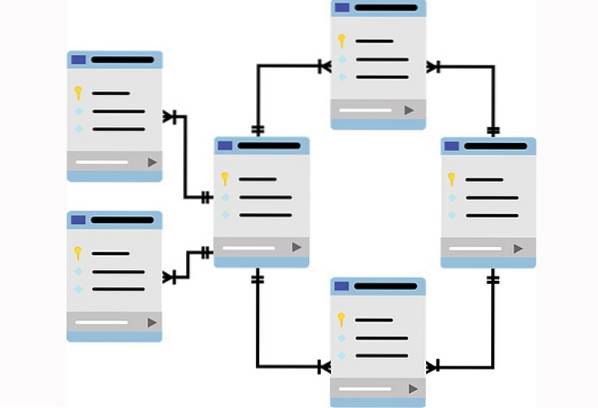
Some of the entities may not be related to any other entity. On the other hand, other entities can have multiple relationships. A more modern representation of the E-R diagram is as follows:

- Make sure that each entity appears only once in the diagram.
- In the diagram, each entity, relationship and attribute must be given a name.
- The relationships between entities must be carefully examined. Are they really necessary? Are there any relationships to be defined? Any redundant relationships must be eliminated. Relationships don't connect with each other.
- It is recommended to use colors to highlight important parts of the diagram.
There are two reasons to create a relationship entity diagram for a database: You are designing a new model or you need to document your existing structure..
If you have an existing database that needs to be documented, create an entity relationship diagram using the data directly from the database:

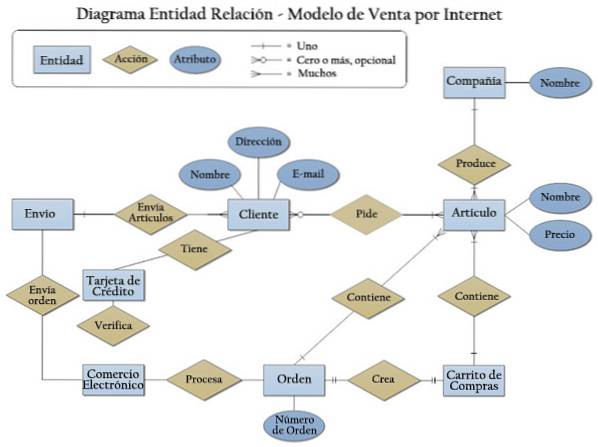
Here is an example of the entity relationship model for Internet sales, using an entity relationship diagram:

Yet No Comments